Chapter 3.1.1 htop
htop is an ncurses text interface task manager that can be controlled by the keyboard. htop also closes unresponsive programs by killing the process.
Usage
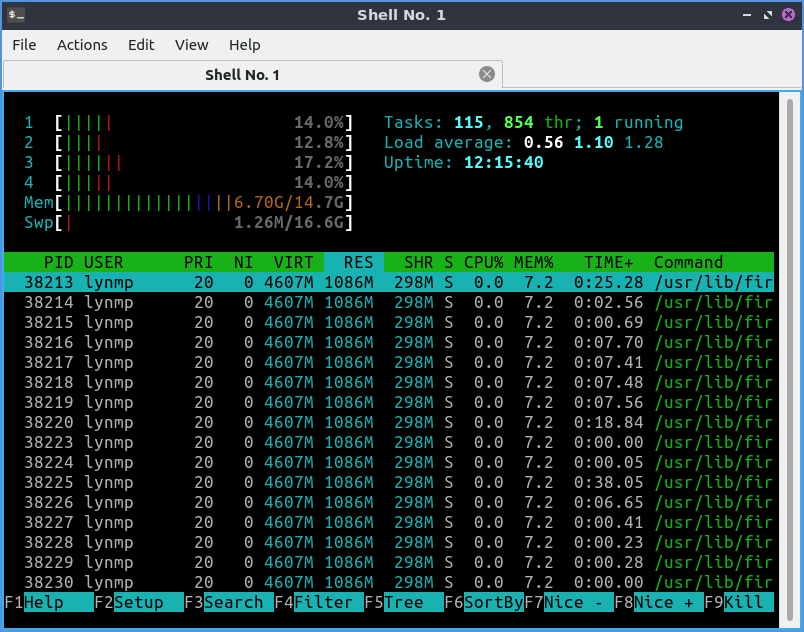
To view how much RAM is being used on your system is under Mem and then a [ number based on how many Gigabytes of memory. The Swp line lists how much swap is used. The numbers going down with a bar with a percentage next to them display CPU usage on each of your CPU cores.
To see how many process are running on your system see the Tasks row. Load average shows your system load over the past one five and fifteen minute is why there are three numbers see Wikipedia load (computing) for more information. Uptime shows how long your computer has been booted.
After the bottom there is a green bar that says PID for the Process ID of a user, The user the process responds to, RES is how much RAM the process is currently using. CPU% shows how much as a percent of CPU time the process is using, MEM% is a percent of the RAM your process is using. Time shows how long the process has been running. Command shows the command line command of the process. To view any cut off part of the Command field press the Right Arrow to view the cut off area of the window. To move your window back to where it was press the Left Arrow key.
To select the process below the currently selected one press Down Arrow to select the process below. To select the process above the currently selected one press Up Arrow to select the process above. To select the next group of processes on your screen press Page Down or move the scrollwheel on the mouse down. To select the previous group of process on your screen press Page up or move the mousewheel up. To choose the last process on your system press the End key. To choose the first process press the Home key.

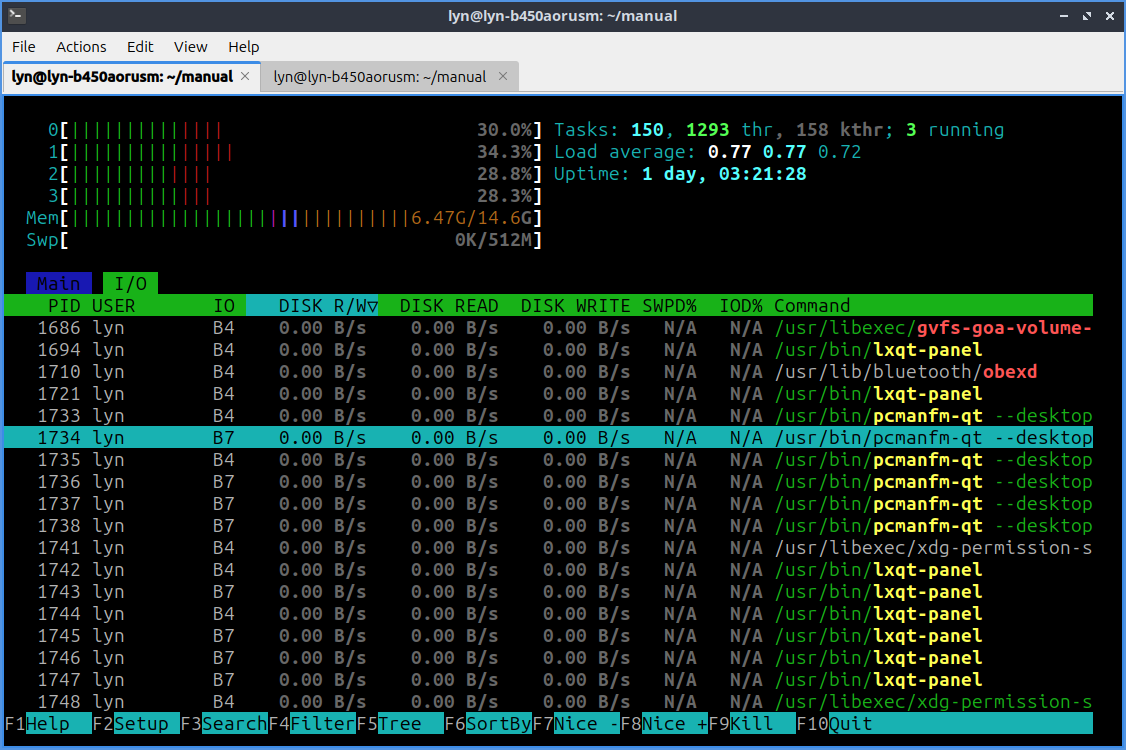
To see what is writing to your hard drive or solid state drive press the Tab key to see how much is being written or read. To see the process id of something writing to disk read the PID column. To see what user is reading or writing to disk read the USER column. To see the total of your disk being read or written by a process see the DISK R/W column. To see how much is being read from storage read the DISK READ column. To see how much is being written to storage see the DISK WRITE column. To see what command is reading or writing to disk read the Command column. To change how to sort which I/O options are taking place press F6. To switch back to viewing CPU and memory usage press Tab again.

You can press F1 or ? to bring up a help dialog on htop. Pressing F3 or / lets you search for a particular process. Pressing F4 makes it so you can only see processes matching a certain pattern. To get out of the view of your search for a pattern press the Escape key. To reverse sort order press Shift +I. Pressing F5 is what you press to view the processes in a tree. To get back to the default view press F5 again. Pressing F9 lets you kill a process with different signals to send to the process and 15 will terminate the process while 9 will Kill it. Lastly pressing F10 or q will quit htop and return you to a terminal.

To change how your process are sorted press F6 which will bring up your own menu to sort by by PID, USER, Priority, NICE, M_Size, M_Resident, M_Share, State, Percent_CPU, Percent_Mem, Time, or Command. To select a menu item press Enter.
Customizing
F2 brings about a customizable settings on htop. To close settings press F10.
The Display Options has option for different ways to display in htop. To move between options press Up Arrow or Down Arrow. To toggle an option on press Spacebar. The Colors tab brings up different color schemes for htop. To select a different color scheme press the Up Arrow or Down Arrow keys. To select a new color scheme press the Spacebar key.

To change the header columns of htop on the top select tab. In each of these options the numbers on the right represents the width of the column is the percent of the width of the window.
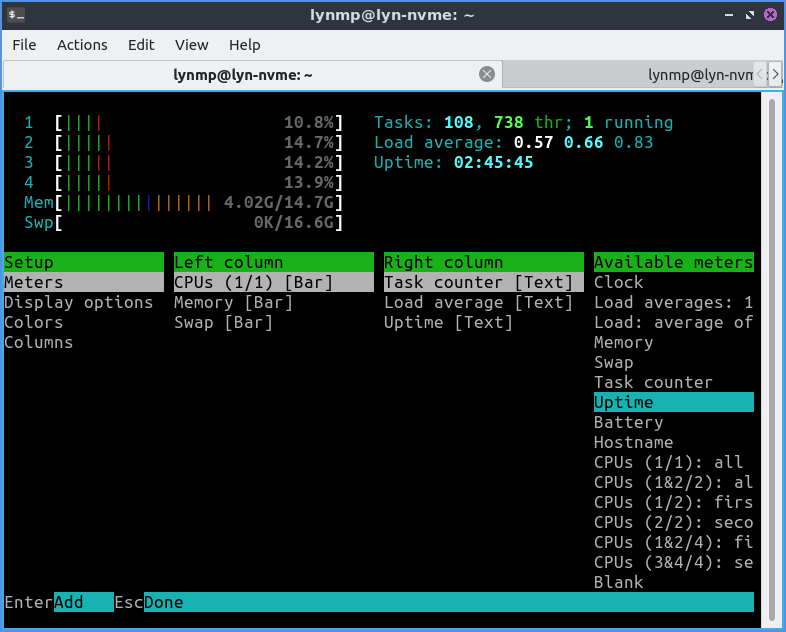
The Meters options brings up meters like CPU average. To see what kind of meter you have it will be shown in brackets. To move a meter press Enter and press the arrow keys to move in the direction of the meter you want to select. To save a meter in that place press Enter again. To delete a meter press Delete. To add new meter move all the way to the right by pressing the Right arrow under Available meters. To add a meter press Enter and to select which one press the arrow keys.
To change what columns end up showing select Columns on the setup menu. The column Active Columns shows what columns you will have on htop with the top being the leftmost column in htop and the bottom being the rightmost. To select a different column press Up arrow or Down arrow. To move a column up in the list press F7. To move a column down press F8. To remove a column press F9. To see what other columns there is the column Available Columns. To add a column when having Available Columns and select the column you want and press F5.
Version
Lubuntu ships with version 3.3.0 of htop.
How to launch
To launch htop from the menu with the Icon that looks like the green H made out of text or run
htop
from the command line.